Introduction to Trading View and Its Key Features
In the fast-paced world of financial markets, having the right tools can make the difference between success and missed opportunities. trading view has emerged as a dominant platform that caters to traders and investors worldwide. Its comprehensive suite of charting tools, social features, and real-time data access provides users with an unparalleled environment to analyze markets effectively and collaboratively. Trading View is more than just a charting tool; it’s a community where ideas flow freely, strategies evolve, and traders stay ahead of market trends. Whether you’re a seasoned professional or a beginner, understanding what makes Trading View stand out is critical for optimizing your market analysis process.
What is Trading View and Why Do Traders Use It?
Trading View is a social financial analysis platform that combines advanced charting capabilities with social networking features. Originally launched as a web-based service, it now offers mobile apps, desktop versions, and integrations with brokerage platforms. Traders and investors use Trading View to visualize data, create technical analysis, share insights, and follow market movements across a wide range of asset classes including stocks, cryptocurrencies, forex, commodities, and indices.
One of the key reasons traders rely on Trading View is its cloud-based infrastructure, which ensures real-time data synchronization across devices, fostering a seamless analysis experience. Additionally, its intuitive interface lowers the barrier to entry for new traders while providing extensive customization options for advanced users. As a result, Trading View has developed into a vibrant ecosystem of market enthusiasts exchanging ideas, strategies, and forecasts.
Overview of Core Tools: Charts, Indicators, and Social Features
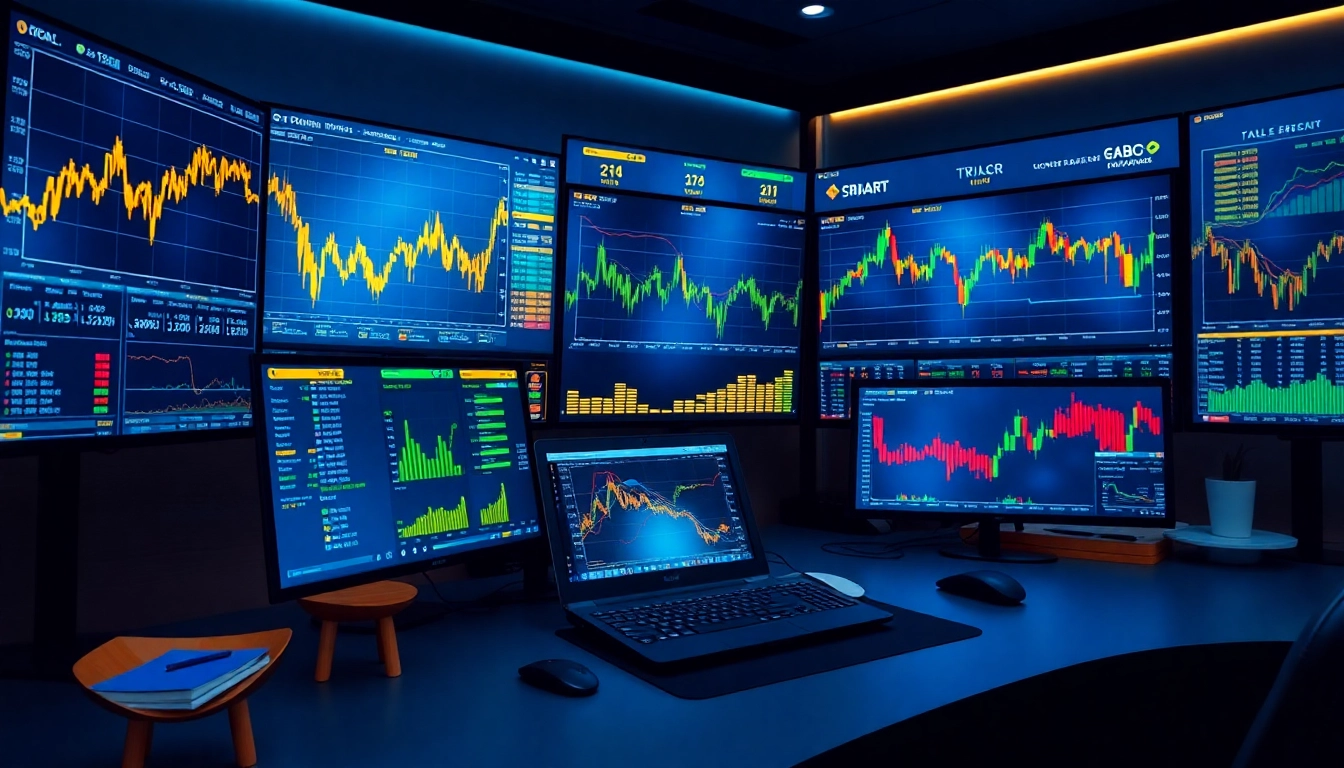
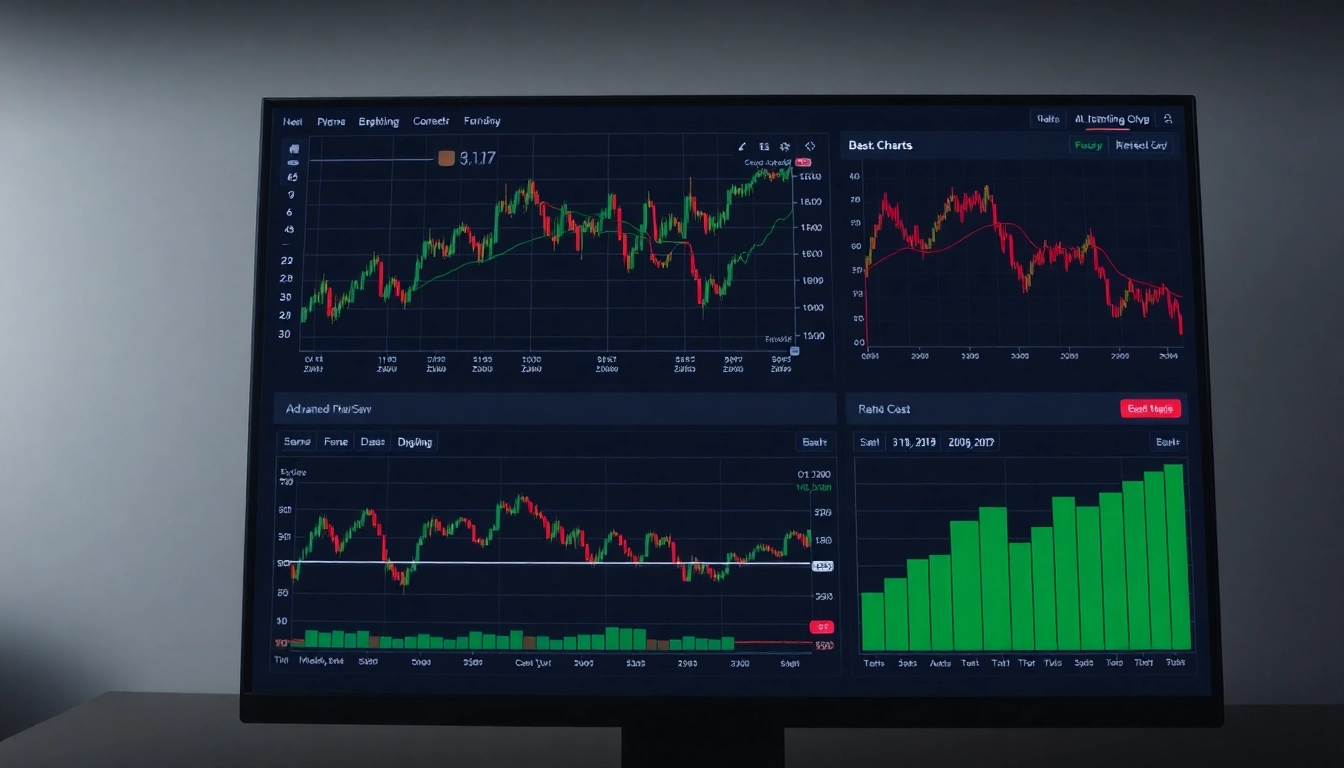
At the heart of Trading View are its powerful charting tools. These charts are interactive, customizable, and support a variety of technical analysis indicators such as Moving Averages, RSI, MACD, Bollinger Bands, and more. Users can apply multiple indicators simultaneously, overlay them onto charts, and tailor the visual presentation for clarity and precision.
Aside from technical indicators, Trading View offers drawing tools—including trend lines, Fibonacci retracements, and pattern recognition tools—that help traders visually identify potential support and resistance levels, price patterns, and trend channels. The platform’s social features enable users to publish ideas, comment on others’ analyses, and collaborate in real-time or asynchronously. This social dimension fosters a learning environment and facilitates community-driven insights, enhancing the overall trading experience.
Benefits of Using Trading View for Market Analysis
- Real-Time Data Access: Access to live market data across numerous markets ensures that traders base decisions on current information.
- Customizability: Nearly every aspect of the platform can be personalized, from watchlists to chart layouts.
- Community Insights: Sharing ideas and viewing others’ analyses provide diverse market perspectives and enhance understanding.
- Multi-Device Compatibility: Start analyzing on your desktop and continue on your mobile device seamlessly.
- Automation and Alerts: Set automated alerts for specific price levels or technical indicator signals to stay updated without constant monitoring.
This combination of features makes Trading View a comprehensive, user-friendly, and powerful platform suitable for traders at all levels, helping them make informed decisions backed by thorough analysis.
Setting Up Your Trading View Workspace for Optimal Efficiency
Customizing Charts and Watchlists
To maximize efficiency, traders should customize their workspace to align with their trading style. Begin by creating and organizing watchlists that track selected assets—be it stocks, cryptocurrencies, or forex pairs. Custom watchlists improve quick access and monitoring of relevant instruments.
Customizing charts involves selecting preferred timeframes (e.g., 1-minute, daily, weekly), chart types (candlestick, line, bar), and color schemes for clarity. Save multiple chart layouts dedicated to different strategies or markets, enabling rapid switching based on market conditions. Additionally, applying and saving indicators that suit your analysis approach streamlines the workflow and facilitates quicker decision-making.
Integrating Alerts and Notifications
Effective trading requires timely updates. Trading View allows you to set alerts based on price levels, indicator conditions, or drawing tools. For instance, you might set an alert when Bitcoin crosses a specific resistance level or when the RSI indicates oversold conditions.
Notifications can be delivered via email, SMS, or app alerts so you can react promptly without constantly watching the screens. Organize alerts based on priority and relevance to avoid information overload. Combining alerts with automation enhances your ability to respond swiftly to evolving market conditions.
Organizing Multiple Markets and Asset Classes
A well-organized workspace involves grouping different asset classes—stocks, forex, cryptocurrencies—for easier comparison and analysis. Use multiple tabs and monitor specific sectors or asset groups simultaneously to identify correlated movements. For example, tracking commodities alongside currency pairs can provide insights into macroeconomic trends.
Additionally, label your chart templates clearly to facilitate quick access and consistency across analyses. Regularly review and update your workspace setup to adapt to changing market dynamics or evolving trading strategies.
Advanced Trading View Strategies and Techniques
Utilizing Technical Indicators for Better Predictions
Technical indicators form the backbone of sophisticated market analysis. Combining indicators such as Moving Averages, RSI, and MACD can generate high-probability trade signals. For example, a crossover of two moving averages combined with RSI divergence might suggest a strong trend reversal.
Back-testing strategies within Trading View allows you to evaluate indicator configurations against historical data, refining your approach before deploying real capital.
Applying Drawing Tools for Pattern Recognition
Drawing tools like trend lines, channels, and Fibonacci retracements are vital for visual pattern recognition. Recognizing head-and-shoulders, double tops/bottoms, or flag patterns can significantly improve timing for entries and exits. Use these tools to define areas of interest and prepare for potential breakout or breakdown scenarios.
Consistent practice in pattern identification, aided by automatic pattern recognition features, enhances your ability to anticipate market moves with greater accuracy.
Leveraging Community Ideas for Market Insights
Trading View’s social platform offers a treasure trove of market ideas shared by thousands of traders globally. By reviewing top-performing ideas, analyzing different viewpoints, and participating in discussions, traders can broaden their understanding of potential market directions.
Employing community insights as part of your overall analysis helps you confirm or challenge your own hypotheses, leading to more robust trading decisions.
Optimizing Trading View for Different Trading Styles
Day Trading and Scalping Tactics
Day traders and scalpers require real-time data, quick decision-making, and minimal analysis delay. Use ultra-short timeframes (1-minute, 5-minute) with fast-moving indicators such as VWAP or Stochastic Oscillator to identify quick entry and exit points. Custom alerts for rapid price moves are essential for capturing small profits frequently.
Swing Trading with Market Trends
Swing traders focus on medium-term trends, typically holding positions from days to weeks. Use daily or 4-hour charts with trend-following indicators like moving averages and MACD. Recognize consolidation zones and breakout points to time entries aligned with broader market momentum.
Long-Term Investment Analysis
Long-term investors leverage weekly or monthly charts to assess underlying fundamentals and macroeconomic trends. Emphasize larger pattern analysis, volume trends, and economic indicators. Using Trading View’s fundamental data and integrated news feeds supports a comprehensive approach to investment decisions.
Measuring Success and Improving Your Trading View Experience
Analyzing Performance Metrics
Tracking your trading performance involves analyzing win-loss ratios, average gain/loss per trade, and drawdowns. Use Trading View’s journal and annotation features to record reasons for trades, outcomes, and lessons learned. Over time, refining your strategy based on these metrics leads to consistency.
Adapting Strategies Based on Market Data
Markets evolve, necessitating ongoing strategy adjustments. Regularly review your analysis results and tweak indicators, timeframes, or asset allocations. Use Trading View’s backtesting tools to simulate changes and assess potential improvements.
Staying Updated with Platform Enhancements
Trading View actively updates its platform with new features, indicators, and integrations. Staying informed through release notes, webinars, or community discussions ensures you leverage the latest tools to maintain a competitive edge.